
Continuing the trend
Use Case
You want to simulate the further development of your sales revenue by continuing the trend of the last business years.
Calculation
The above situation has an impact on the P&L account ‘Sales Revenue’, which has shown the following values in the past:
Business figure | Account number | Amount | ||||
31/12/2019 | 31/12/2020 | 31/12/2021 | 31/12/2022 | 31/12/2023 | ||
Sales Revenue | 10001 | 125,000.00 | 138,000.00 | 145,000.00 | 152,000.00 | 165,000.00 |
The simulation of the future development of sales revenue can be called up using the Forecast Trend function in the Control File as follows:
[10001] = Forecast trendResult
As the historical values of the P&L account ‘Sales Revenue’ approximately lie on a straight line, a linear continuation of the values of the time series is automatically applied.
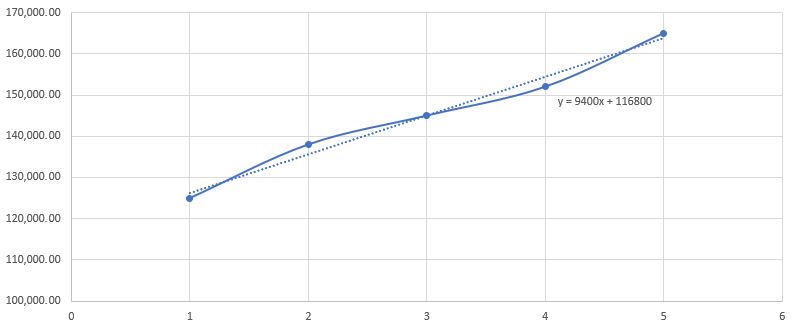
The simulated values of the P&L account ‘Sales Revenue’ then amount to
31/12/2024: 9,400.00 * 6 + 116,800.00 = 173,200.00
31/12/2025: 9,400.00 * 7 + 116,800.00 = 182,600.00
31/12/2026: 9,400.00 * 8 + 116,800.00 = 192,000.00
Variant
In the past, the historical values of the P&L account ‘Sales Revenue’ initially grew relatively quickly and then more and more slowly:
Business figure | Account number | Amount | ||||
31/12/2019 | 31/12/2020 | 31/12/2021 | 31/12/2022 | 31/12/2023 | ||
Sales Revenue | 10001 | 125,000.00 | 138,000.00 | 145,000.00 | 150,000.00 | 153,000.00 |
Also in this situation, the simulation of the future development of sales revenue can be called up using the Forecast Trend function in the Control File as follows:
[10001] = Forecast trendIn this case, however, a logarithmic continuation of the values of the time series is automatically applied.
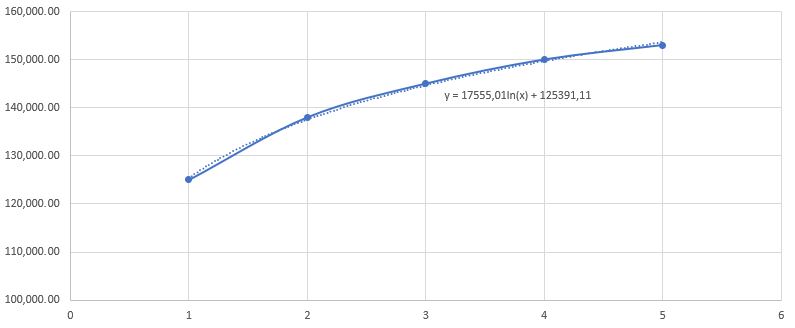
The simulated values of the P&L account ‘Sales Revenue’ then amount to
31/12/2024: 17,555.01 * ln(6) + 125,391.11 = 156,845.46
31/12/2025: 17,555.01 * ln(7) + 125,391.11 = 159,551.58
31/12/2026: 17,555.01 * ln(8) + 125,391.11 = 161,895.72