
Forecast Trend
Description
The Forecast Trend function uses for the calculation of business figures the historical time series of the values of the business figure and continues the value of this time series. It is automatically determined whether a linear, logarithmic or exponential continuation should be used.
Using this Function
Syntax
In the Control File, the Forecast Trend function is called up as follows:
[account] = Forecast TrendParameters
[account]
Business figure for which the value should be calculated.
This must be included in the following input data and must contain historical values for at least two reference dates in the past: Input Files | Financial-Data
Examples
Example 1
[10002] = Forecast trendhistorical values of the business figure [10002]: (18,500.00, 21,000.00, 23,000.00, 24,000.00, 24,500.00)
The use of the least squares method shows that the historical values of the business figure can best be approximated by a logarithmic curve, so that a logarithmic continuation of the values of the time series is applied.
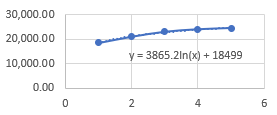
new value of the business figure [10002]: 3,865.20 * ln(6) + 18,499.00 = 25,424.51
Example 2
[10008] = Forecast trend if reference rate decreaseshistorical values of the business figure [10008]: (2,000.00, 2,100.00, 2,200.00, 2,300.00, 2,400.00)
As the historical values of the business figure are all on a straight line, the use of the least squares method implies that a linear continuation of the values of the time series is applied.
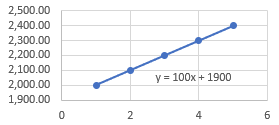
new value of the business figure [10008]: 100.00 * 6 + 1,900.00 = 2,500.00